
In the last fifteen years the number of households living in social housing has risen, with increases seen across a range of demographic groups.
But that growth has not been evenly distributed. A striking share of the increase has come from households headed by people who are not UK or Irish nationals.
On rounded estimates, the rise in non-UK/Irish-headed households is equivalent to roughly 90% of the net increase in the total number of social-rented households seen between 2010/11 and 2024/25.
About the English Housing Survey
Social housing figures are based on annual English Housing Survey (EHS) data, weighted to estimate the position across England. They should therefore be treated as estimates, usually rounded to the nearest 1,000, rather than exact administrative counts.
The EHS is an Accredited Official statistic and is one of the longest running government surveys. The latest figures, covering April 2024 to April 2025, classify households by the nationality of their Household Reference Person (HRP), the individual used by the EHS to represent and classify the household.
What the EHS shows
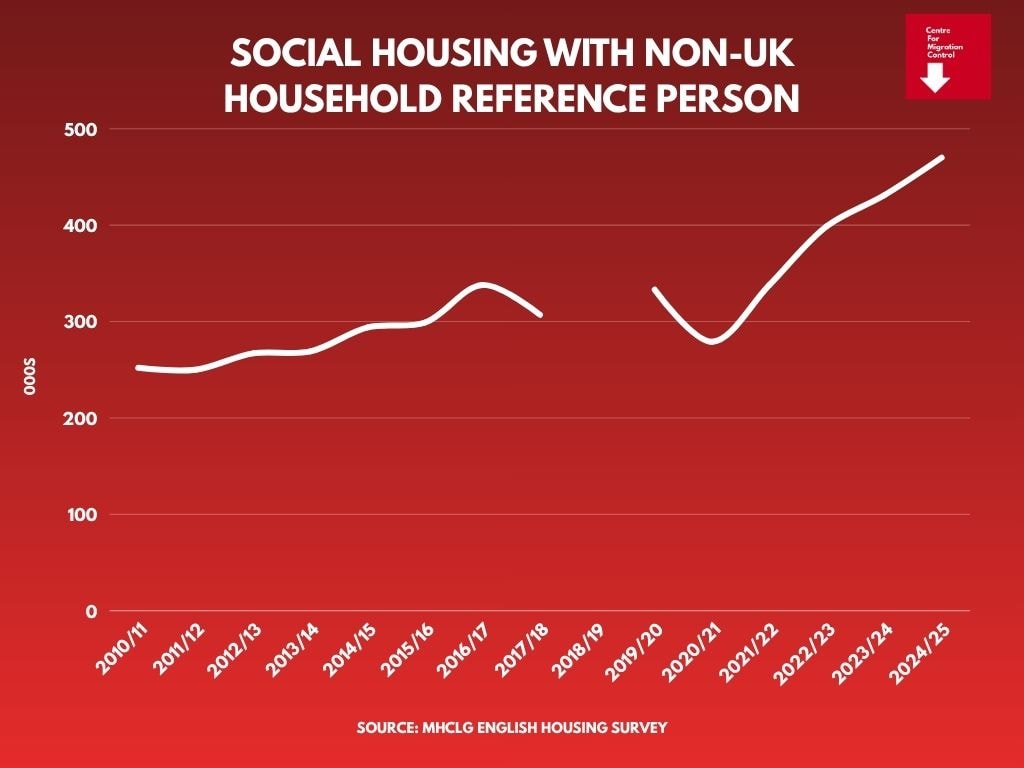
In 2024/2025, an estimated 177,000 social-rented households had a European national as their HRP, while a further 293,000 had an “other nationality”, meaning a nationality outside the UK, Republic of Ireland and the EHS European category.
Combined, around 470,000 social-rented households were headed by someone who was neither a UK nor Irish national.
This growth is most stark amongst households with a reference person who is from outside Europe. In 2016/17 there were 200,000 HRP from outside Europe in social housing. By 2024/25, this figure had risen to 293,000 — an increase of 93,000 (46.5%).
By contrast, in 2016/17 there were 138,000 HRP from Europe. In 2024/25, there were 177,000 — an increase of 39,000 (28%).
In 2010/11 the estimated number of non-UK/Irish-led households in social housing was 252,000. This therefore represents an increase of around 218,000 households, or 86.5%, over the period.
Foreign national share of social housing
The share of social-rented households headed by a non-UK/Irish national rose from 6.6% in 2010/11 to 11.5% in 2024/25.
Much of that increase is concentrated in the post-Covid period: the share rose from around 7.0% in 2020–21 to 11.5% four years later. That increase is considerably faster than the growth of the social rented sector as a whole.
The estimated total number of social-rented households in England rose from 3,826,000 in 2010/11 to around 4,077,000 in 2024/25, an increase of roughly 251,000 households, or 6.6%.
On these rounded estimates, the increase in households headed by non-UK/Irish nationals is equivalent to roughly 90% of the net increase in the overall number of social-rented households over the same period.
The published English Housing Survey tables did not separately identify EU and non-EU social-renting households before 2016/17, instead grouping non-UK/Irish nationalities together as ‘other nationalities’. No like-for-like nationality-by-tenure table was published in the 2018/19 EHS annual reports.
New tenancies
We also have data from social housing providers submitted via CORE to the MHCLG, which allows us to see the number of new social housing tenancies in a year by nationality of the lead tenant.
The picture is one defined by a stark decline of new social lettings going to households led by a UK national. In 2024/25, there were 233,198 lettings to these households. This was down from 340,384 in 2010/11, a fall of 31.5%.
On the other side of the equation, lettings to those headed by an EEA national fell from 10,592 in 2010/11 to 9,830 in 2024/25. Lettings to ‘All other countries’ rose from 14,852 to 19,916.
CORE data also allows us to see the top non-UK nationalities receiving a new tenancy in 2024/25:
| Nationality | New tenancies (2024/25) |
|---|---|
| Poland | 2,685 |
| Iran | 1,451 |
| Afghanistan | 1,336 |
| Eritrea | 1,060 |
| Ukraine | 1,055 |
| Pakistan | 924 |
| Sudan | 864 |
| Portugal | 795 |
| Romania | 746 |
| Lithuania | 620 |
| Iraq | 598 |
| Nigeria | 546 |
| Syria | 478 |
| Latvia | 429 |
| Italy | 417 |
Annex: The Data
| EHS Year | Total households in social housing (to nearest 1,000) | EU HRP households in social housing | Non-EU HRP households in social housing | Households with non-UK/Irish HRP (% of social-rented households) | Methodology |
|---|---|---|---|---|---|
| 2010–11 | 1,835,000 LA 1,992,000 HA Total: 3,826,000 |
N/A | N/A | 142,000 LA (7.7%) 110,000 HA (5.5%) 252,000 total (6.6%) |
Direct published EHS weighted count. |
| 2011–12 | 1,782,000 LA 2,026,000 HA Total: 3,808,000 |
N/A | N/A | 146,000 LA (8.2%) 103,000 HA (5.1%) 250,000 total (6.6%) |
Direct published EHS weighted count. |
| 2012–13 | 1,684,000 LA 2,000,000 HA Total: 3,684,000 |
N/A | N/A | 155,000 LA (9.2%) 112,000 HA (5.6%) 267,000 total (7.2%) |
Direct published EHS weighted count. |
| 2013–14 | 1,641,000 LA 2,279,000 HA Total: 3,920,000 |
N/A | N/A | 125,000 LA (7.6%) 144,000 HA (6.3%) 269,000 total (6.9%) |
Direct published EHS count. |
| 2014–15 | 1,639,000 LA 2,272,000 HA Total: 3,912,000 |
N/A | N/A | 126,000 LA (7.7%) 168,000 HA (7.4%) 294,000 total (7.5%) |
Direct published EHS count. |
| 2015–16 | 1,605,000 LA 2,313,000 HA Total: 3,918,000 |
N/A | N/A | 135,000 LA (8.4%) 164,000 HA (7.1%) 299,000 total (7.6%) |
Direct published EHS count. |
| 2016–17 | 1,566,000 LA 2,381,000 HA Total: 3,947,000 |
66,000 EU LA 72,000 EU HA 138,000 EU total |
115,000 RoW LA 85,000 RoW HA 200,000 RoW total |
181,000 LA (11.6%) 157,000 HA (6.6%) 338,000 total (8.6%) |
Direct published EHS count. |
| 2017–18 | 1,581,000 LA 2,377,000 HA Total: 3,958,000 |
57,000 EU LA 84,000 EU HA 141,000 EU total |
77,000 RoW LA 89,000 RoW HA 166,000 RoW total |
134,000 LA (8.5%) 173,000 HA (7.3%) 307,000 total (7.8%) |
Direct published EHS count. |
| 2018–19 | 1,591,000 LA 2,372,000 HA Total: 3,963,000 |
N/A | N/A | N/A | No like-for-like nationality-by-tenure breakdown published in the 2018–19 EHS Headline Report or Housing Across the Life Course annex tables. |
| 2019–20 | 1,581,000 LA 2,398,000 HA Total: 3,978,000 |
55,000 EU LA 86,000 EU HA 141,000 EU total |
97,000 RoW LA 95,000 RoW HA 192,000 RoW total |
152,000 LA (9.6%) 181,000 HA (7.5%) 333,000 total (8.4%) |
Direct published EHS count. |
| 2020–21 | 1,570,000 LA 2,414,000 HA Total: 3,984,000 |
47,000 EU LA 67,000 EU HA 115,000 EU total |
84,000 RoW LA 81,000 RoW HA 164,000 RoW total |
131,000 LA (8.3%) 148,000 HA (6.1%) 279,000 total (7.0%) |
Direct published EHS count. |
| 2021–22 | 1,572,000 LA 2,456,000 HA Total: 4,028,000 |
49,000 EU LA 91,000 EU HA 140,000 EU total |
80,000 RoW LA 118,000 RoW HA 198,000 RoW total |
129,000 LA (8.2%) 209,000 HA (8.5%) 338,000 total (8.4%) |
Direct published EHS count. |
| 2022–23 | 1,531,000 LA 2,475,000 HA Total: 4,006,000 |
64,000 EU LA 106,000 EU HA 170,000 EU total |
130,000 RoW LA 99,000 RoW HA 229,000 RoW total |
194,000 LA (12.7%) 205,000 HA (8.3%) 399,000 total (10.0%) |
Direct published EHS count. |
| 2023–24 | 1,548,000 LA 2,506,000 HA Total: 4,053,000 |
82,000 EU LA 99,000 EU HA 180,000 EU total |
105,000 RoW LA 146,000 RoW HA 251,000 RoW total |
187,000 LA (12.1%) 246,000 HA (9.8%) 431,000 total (10.6%) |
Direct published EHS count. |
| 2024–25 | 1,529,000 LA 2,548,000 HA Total: 4,077,000 |
75,000 EU LA 102,000 EU HA 177,000 EU total |
127,000 RoW LA 166,000 RoW HA 293,000 RoW total |
202,000 LA (13.2%) 268,000 HA (10.5%) 470,000 total (11.5%) |
Direct published EHS count. |
Notes: LA = Local Authority; HA = Housing Association; HRP = Household Reference Person; RoW = Rest of World (non-UK, non-Irish, non-European). All figures are EHS weighted estimates rounded to the nearest 1,000. The EHS did not publish a separate EU/non-EU nationality-by-tenure breakdown before 2016/17. No like-for-like nationality-by-tenure table was published in the 2018/19 EHS annual reports. Pandemic-related fieldwork disruption in 2020/21 may affect the reliability of estimates for that year.
Source
All figures are drawn from the English Housing Survey, published by the Ministry of Housing, Communities and Local Government.